“Outsourcing” is a loaded term. In today’s globalised world it has become to mean many things – from using technology to outsource rote work over the internet to sharing capacity with external partners that are more specialised to complete a certain task. However, inherent in the idea of outsourcing is the promise of reduced costs, either through reductions in labour costs, or via savings in overheads and tied-up capital.
I recently stumbled across a 2001 paper [1] by Dr Hart-Smith of the Boeing Company, discussing some of the dangers and fallacies in our thinking regarding the potential advantages of outsourcing. The points raised by Hart-Smith are particularly noteworthy as they deal with the fundamental goals of running a business rather than trying to argue by analogy, or blind faith on proxy measurements. What follows is my take on the issue of outsourcing as it pertains to the aerospace industry only, loosely based on the insights provided by Dr Hart-Smith, and with some of my own understanding of the topic from disparate sources that I believe are pertinent to the discussion.
That being said, the circumstances under which outsourcing makes economical sense depends on a broad spectrum of variables and is therefore highly complex. If you feel that my thinking is misconstrued in any way, please feel free to get in touch. With that being said let’s delve a bit deeper into the good, the bad and the ugly of the outsourcing world.
Any discussion on outsourcing can, in my opinion, be boiled down to two fundamental drivers:
- The primary goal of running a business: making money. Taking non-profits aside, a business exists to make a profit for its shareholders. If a business doesn’t make any money today, or isn’t expected to make a profit in the future, i.e. is not valuable on a net present value basis, then it is a lousy business. Any other metric that is used to measure the performance of a business, be it efficiency ratios such as return on capital employed, are helpful proxies but not the ultimate goal.
- Outsourcing is based on Ricardo’s idea of comparative advantage, that is, if two parties decide to specialise in the production of two different goods and decide to trade, both parties are better off than if they produced both goods for autarchic use only, even if one party is more efficient than the other at producing both goods at the same time.
Using these two points as our guidelines it becomes clear very quickly under what conditions a company should decide to outsource a certain part of its business:
- Another company is more specialised in this line of business and can therefore create a higher-quality product. This can either be achieved via:
- Better manufacturing facilities, i.e. more precisely dimensioned components that save money in the final assembly process
- Superior technical expertise. A good example are the jet engines on an aircraft. Neither Boeing nor Airbus design or manufacture their own engines as the complexity of this particular product means that other companies have specialised to make a great product in this arena.
- The rare occasion that outsourcing a particular component of an aircraft results in a net overall profit for the entire design and manufacturing project. However, the decision to outsource should never be based on the notion of reduced costs for a single component, as there is no one-to-one causation between reducing costs for a single component and increased profits for the whole project.
Note, that in either case the focus is on receiving extra value for something the company pays for rather than on reducing costs. In fact, as I will explain below, outsourcing often leads to increases in cost, rather than cost reductions. Under these circumstances, it only makes sense to outsource if this additional cost is traded for extra value that cannot be created in house, i.e. manufacturing value or technical value.
Reducing Costs
Reducing costs is another buzzword that is often used to argue pro outsourcing. Considering the apparent first-order effects, it makes intuitive sense that offloading a certain segment of a business to a third party will reduce costs via lower labour costs and overheads, depreciation and capital outlays. In fact, this is one of the allures of the globalised world and the internet; the means of outsourcing work to lower-wage countries are cheaper than ever before in history.
However, the second-order effects of outsourcing are rarely considered. The first fundamental rule of ecology is that in a complex system you can never only do one thing. As all parts of a complex system are intricately linked, perturbing the system in one area will have inevitable knock-on effects in another area. Additionally if the system behaves non-linearly to the external stimuli, these knock-on effects are non-intuitive and almost impossible to predict a priori. Outsourcing an entire segment of a project should probably be classed as a major perturbation, and as all components of a complex engineering product, such as an aircraft, are inherently linked, a decision in one area will certainly effect other areas of the project as well. Hence, consider the following second-order effects that should be accounted for as a result of outsourcing as certain line of a business:
- Quality assurance is harder out-of-house, and hence reworking components that are not to spec may cost more in the long run.
- Additional labour may be required in-house in order to coordinate the outsourced work, interact with the third party and interface the outsourced component with the in-house assembly team.
- Concurrent engineering and the ability to adapt designs is much harder. In order to reduce their costs, subcontractors often operate on fixed contracts, i.e. the design specification for a component is fixed or the part to be manufactured can not be changed. Hence, the flexibility to adapt the design of a part further down the line is constricted, and this constraint may create a bottleneck for other interfacing components.
- Costs associated with subassemblies that cannot be fitted together balloon quickly, and the ensuing rework and detective work to find the source of the imprecision delays the project.
- There is a need for additional transportation due to off-site production and increased manufacturing time.
- It is harder to coordinate the manufacturing schedules of multiple external subcontractors who might all be employing different planning systems, and more inventory is usually created.
Therefore there is an inherent clash between trying to minimise costs locally, i.e. the costs for one component in isolation, and keeping costs down globally, i.e. for the entire project. In the domain of complex systems, local optimisation can lead to fragility of the system in two ways. First, small perturbations from local optima typically have greater effects on the overall performance of the system than perturbations from locally sub-optimal states. Second, locally optimising one factor of the system may force other factors to be far from their optima, and hence reduce the overall performance of the system. A general heuristic is that the best solution is to reach a compromise by operating individual components at sub-optimal levels, i.e. with excess capacity, such that the overall system is robust to adapt to unforeseen perturbations in its operating state.
Furthermore, the decision to outsource the design or the manufacture of a specific component needs to factored into the overall design of the product as a early as possible. Thus, all interfacing assemblies and sub-assemblies are designed with this particular reality in mind, rather than having to adapt to this situation a posteriori. This is because early design decisions have the highest impact on the final cost of a product. As a general rule of thumb, 80% of the final costs are incurred by the first 20% of the design decisions made, such that late design changes are always exponentially more expensive than earlier ones. Having to fix misaligned sub-assemblies at final assembly costs orders of magnitude more than additional planning up front.
Finally, the theory of constraints teaches us that the performance of the overall project can never exceed that of its least proficient component. Hence, the overall quality of the final assembly is driven by the quality of its worst suppliers. This means that in order to minimise any problems, the outsourcing company needs to provide extra quality and technical support for the subcontractors, extra employees for supply chain management, and additional in-house personal to deal with the extra detail design work and project management. Dr Hart-Smith warns that
With all this extra work the reality is that outsourcing should be considered as an extra cost rather than a cost saving, albeit, if done correctly, for the exchange of higher quality parts. The dollar value of out-sourced work is a very poor surrogate for internal cost savings.
Outsourcing Profits
Hypothetically, in the extreme case when every bit of design and manufacturing work is outsourced the only remaining role f0r the original equipment manufacturer (OEM) of the aircraft is to serve as a systems integrator. However, in this scenario, all profits are outsourced as well. This reality is illustrated by a simple example. The engines and avionics comprise about 50% of the total cost of construction of an aircraft, and the remaining 50% are at the OEM’s discretion. Would you rather earn a 25% profit margin on 5% of the total work, or rather 5% profit margin on 25% of the total work? In the former case the OEM will look much more profitable on paper (higher margin) but the total amount of cash earned in the second scenario will be higher. Hence, in a world where 50% of the work naturally flows to subcontractors supplying the engines, avionics and control systems, there isn’t much left of the aircraft to outsource if enough cash is to be made to keep the company in business. Without cash there is no money to pay engineers to design new aircraft and no cash on hand to serve as a temporary buffer in a downturn. If there is anything that the 20th century has taught us, is that in the world of high-tech, any company that does not innovate and purely relies on derivative products is doomed to be disrupted by a new player.
Second, subcontractors are under exactly the same pressure as the OEM to maximise their profits. In fact, subcontractors have a greater incentive for fatter margins and higher returns on investment as their smaller size increases their interest rates for loaned capital. This means that suppliers are not necessarily incentivised to manufacture tooling that can be reused for future products as these require more design time and can not be billed against future products. In-house production is much more likely to lead to this type of engineering foresight. Consider the production of a part that is estimated to cost the same to produce in-house as by a subcontractor, and to the same quality standards. The higher profit margins of the subcontractor naturally result in a higher overall price for the component than if manufactured in-house. However, standard accounting procedures would consider this as a cost reduction since all first-order costs, such as lower labour rate at the subcontractor, fewer employees and less capital tied up in hard assets at the OEM, creates the illusion that outside work is cheaper than in-house work.
Skin in the Game
One of the heavily outsourced planes in aerospace history was the Douglas Aircraft Company DC-10, and it was the suppliers who made all the profits on this plane. It is instrumental that most subcontractors were not willing to be classified as risk-sharing partners. In fact, if the contracts have been negotiated properly, then most subcontractors have very little downside risk. For financial reasons, the systems integrator can rarely allow a subcontractor to fail, and therefore provides free technical support to the subcontractor in case of technical problems. In extreme cases, the OEM is even likely to buy if subcontractor outright.
This state of little downside risk is what NN Taleb calls the absence of “skin in the game” [2]. Subcontractors typically do not behave like employees do. Employees or “risk-sharing” partners have a reputation to protect and fear the economic repercussions of losing their paychecks. On the one hand, employees are more expensive than contractors and limit workforce flexibility. On the other hand, employees guarantee a certain dependability and reliability for solid work, i.e. downside protection to shoddy work. In Taleb’s words,
So employees exist because they have significant skin in the game – and the risk is shared with them, enough risk for it to be a deterrent and a penalty for acts of undependability, such as failing to show up on time. You are buying dependability.
Subcontractors on the other hand typically have more freedom than employees. They fear the law more than being fired. Financial repercussions can be built into contracts, and bad performances may lead to loss in reputation, but an employee, by being part of the organisation and giving up some of his freedom, will always have more risk, and therefore behave in more dependable ways. There are examples, like Toyota’s ecosystem of subcontractors, where mutual trust and “skin in the game” is built into the network via well thought-out profit sharing, risk sharing and financial penalties, but these relationships are not ad hoc and are based on long-term relationships.
With a whole network of subcontractors the performance of an operation is limited by the worst-performing segment. In this environment, OEMs are often forced to assist bad-performing suppliers and therefore forced to accept additional costs. Again from NN Taleb [2],
If you miss on a step in a process, often the entire business shuts down – which explains why today, in a supposedly more efficient world with lower inventories and more subcontractors, things appear to run smoothly and efficiently, but errors are costlier and delays are considerably longer than in the past. One single delay in the chain can stop the entire process.
The crux of the problem is that a systems integrator, who is the one that actually sells the final product, i.e. gets paid last and carries the most tail risk, can only raise the price to levels that the market will sustain. Subcontractors, on the other hand, can push for higher margins and lock in a profit before the final plane is sold and thereby limit their exposure to cost over-runs.
ROE
The return on net assets or return on equity (ROE) metric is a very powerful proxy to measuring how efficiently a company uses its equity or net assets (assets – liabilities; where assets are everything the company owns and liabilities include everything the company owes) to create profit,
[latex] ROE = \frac{Earnings}{Equity}. [/latex]
The difference between high-ROE and low-ROE businesses is illustrated here using a mining company and a software company as (oversimplified) examples. The mining company needs a lot of physical hard assets to dig metals out of the ground, and hence ties up considerable amount of capital in its operations. A software company on the other hand is asset-light as the cost of computing hardware has exponentially fallen in line with Morse Law. Thus, if both companies make the same amount of profit, then the software company will have achieved this more efficiently than the mining company, i.e. required less initial capital to create the same amount of earnings. The ROE is a useful metric for investors, as it provides information regarding the expected rate of return on their investment. Indeed, in the long run, the rate of return on an investment in a company will converge to the ROE.
In order to secure funding from investors and achieve favourable borrowing rates from lenders, a company is therefore incentivised to beef up its ROE. This can either be done by reducing the denominator of the ratio, or by increasing the numerator. Reducing equity either means running a more asset-light business or by increasing liabilities via the form of debt. This is why debt is also a form of leverage as it allows a company to earn money on outside capital. Increasing the numerator is simple on paper but harder in reality; increasing earnings without adding capacity, e.g. by cost reductions or price increases.
Therefore ROE is a helpful performance metric for management and investors but it is not the ultimate goal. The goal of a for-profit company is to make money, i.e. maximise the earnings power. Would you rather own a company that earns 20% on a business with $100 of equity or 5% on company with $1000 of tied up capital? Yes, the first company is more efficient at turning over a profit but that profit is considerably smaller than for the second company. Of course, if the first company has the chance to grow to the size of the second in a few years time, and maintains or even expands its ROE, then this is a completely different scenario and it would be a good investment to forego some earnings now for higher cashflow in the future. However, by and large, this is not the situation for large aircraft manufacturers such as Boeing and Airbus, and restricted to fast-growing companies in the startup world.
Second, it is foolish to assume that the numerator and denominator are completely decoupled. In fact, in a manufacturing-intense industry such as aerospace, the two terms are closely linked and their behaviour is complex, i.e. their are too many cause-and-effect relationships for us to truly understand how a reduction in assets will effect earnings. Blindly reducing assets, without taking into account its effect on the rate and cost of production, can always be considered as a positive effect as it always increase ROE. In this manner, ROE can be misused as a false excuse for excessive outsourcing. Given the complex relationship in the aerospace industry between earnings and net assets, the real value of the ROE ratio is to provide a ballpark figure of how much extra money the company can earn in its present state with a source of incremental capital. Thus, if a company with multiple billions in revenue currently has an ROE of 20%, than it can expect to earn an extra 20% if it employs an incremental amount of further capital in the business, where the exact incremental amount is of course privy to interpretation.
In summary, there is no guarantee that a reduction in assets will directly result in an increase in profits, and the ROE metric is easily misused to justify capital reductions and outsourcing, when in fact, it should be used as a ballpark figure to judge how much additional money can currently be made with more capital spending. Thus, ROE should only be used as a performance metric but never as the overall goal of the company.
A cautionary word on efficiency
In a similar manner to ROE, the headcount of a company is an indicator of efficiency. If the same amount of work can be done by fewer people, then the company is naturally operating more efficiently and hence should be more profitable. This is true to an extent but not in the limit. Most engineers will agree that in a perfect world, perfect efficiency is unattainable as a result of dissipating mechanisms (e.g. heat, friction, etc.). Hence, perfect efficiency can only be achieved when no work is done. By analogy, it is meaningless to chase ever-improving levels of efficiency if this comes at the cost of reduced sales. Therefore, in some instances it may be wise to employ extra labour capacity in non-core activities in order to maintain a highly skilled workforce that is able to react quickly to opportunities in the market place, even if this comes at the cost of reduced efficiency.
So when is outsourcing a good idea?
Outsourcing happens all over the world today. So there is obviously a lot of merit to the idea. However, as I have described above, decisions to outsource should not be made blindly on terms of shedding assets or reducing costs, and need to factored into the design process as early as possible. Outsourcing is a valuable tool in two circumstances:
- Access to better IP = Better engineering design
- Access to better facilities = More precise manufacturing
First, certain components on modern aircraft have become so complex in their own right that it is not economical to design and manufacture these parts in-house. As a result, the whole operation is outsourced to a supplier that specialises in this particular product segment, and can deliver higher quality products than the prime manufacturer. The best example of this are jet engines, which today are built by companies like Rolls-Royce, General Electric and Pratt & Whitney, rather than Airbus and Boeing themselves.
Second, contrary to popular belief, the major benefit of automation in manufacturing is not the elimination of jobs, but an increase in precision. Precision manufacturing prevents the incredibly costly duplication of work on out-of-tolerance parts further downstream in a manufacturing operation. Toyota, for example, understood very early on that in a low-cost operation, getting things right the first time around is key, and therefore anyone on the manufacturing floor has the authority to stop production and sort out problems as they arise. Therefore, access to automated precision facilities is crucial for aircraft manufacturers. However, for certain parts, a prime manufacturer may not be able to justify the high capital outlay for these machines as there is not enough capacity in-house for them to be utilised economically. Under these circumstances, it makes sense to outsource the work to an external company that can pool the work from a number of companies on their machines. This only makes sense if the supplier has sufficient capacity on its machines or is able to provide improved dimensional control, e.g. by providing design for assembly services to make the final product easier to assemble.
Conclusion
After this rather long exposition of the dangers of outsourcing in the aerospace industry, here are some of the key takeaways:
- Outsourcing should not be employed as a tool for cost reduction. More likely than not it will lead to extra labour and higher costs via increased transportation, rework and inventories for the prime manufacturer, and therefore this extra price should be compensated by better design engineering or better manufacturing precision than could be achieved in-house.
- Efficiency is not the primary goal of the operation, but can be used as a useful metric of performance. The goal of the operation is to make money.
- A basic level of work has to be retained in-house in order to generate sufficient cash to fund new products and maintain a highly skilled workforce. If the latter requires extra capacity, a diversification to non-core activities may be a better option than reducing headcount.
- Scale matters. Cost saving techniques for standardised high-volume production are typically inappropriate for low-volume industries like aerospace.
- Recognise the power of incentives. In-house employees typically have more “skin in the game” as risk-sharing partners ,and therefore produce more dependable work than contractors.
Sources
[1] L.J. Hart-Smith. Out-sourced profits – the cornerstone of successful subcontracting. Boeing paper MDC 00K0096. Presented at Boeing Third Annual Technical Excellence (TATE) Symposium, St. Louis, Missouri, 2001.
[2] N.N. Taleb. How to legally own another person. Skin in the Game. pp. 10-15. https://dl.dropboxusercontent.com/u/50282823/employee.pdf

![Flow along a straight streamline [2]](https://rgroh.com/wp-content/uploads/2015/10/Untitled.jpg)
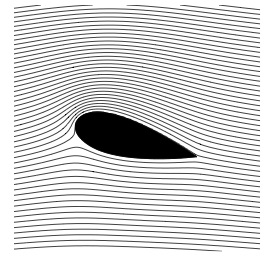
![Flow along a curved streamline [2]](https://rgroh.com/wp-content/uploads/2015/10/Untitled1.jpg)
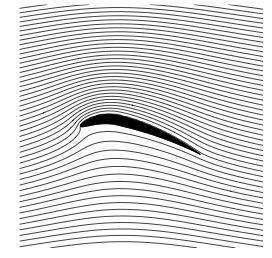
![Flow around a curved airfoil [2]](https://rgroh.com/wp-content/uploads/2015/10/Untitled2.jpg)


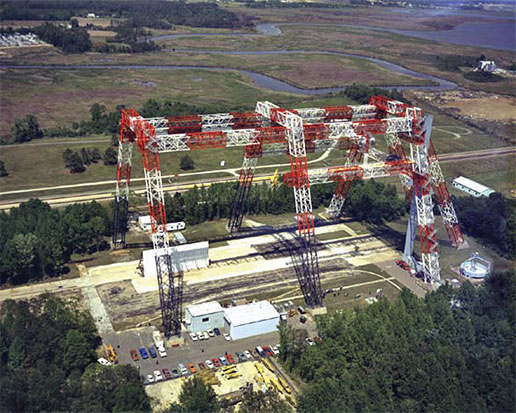
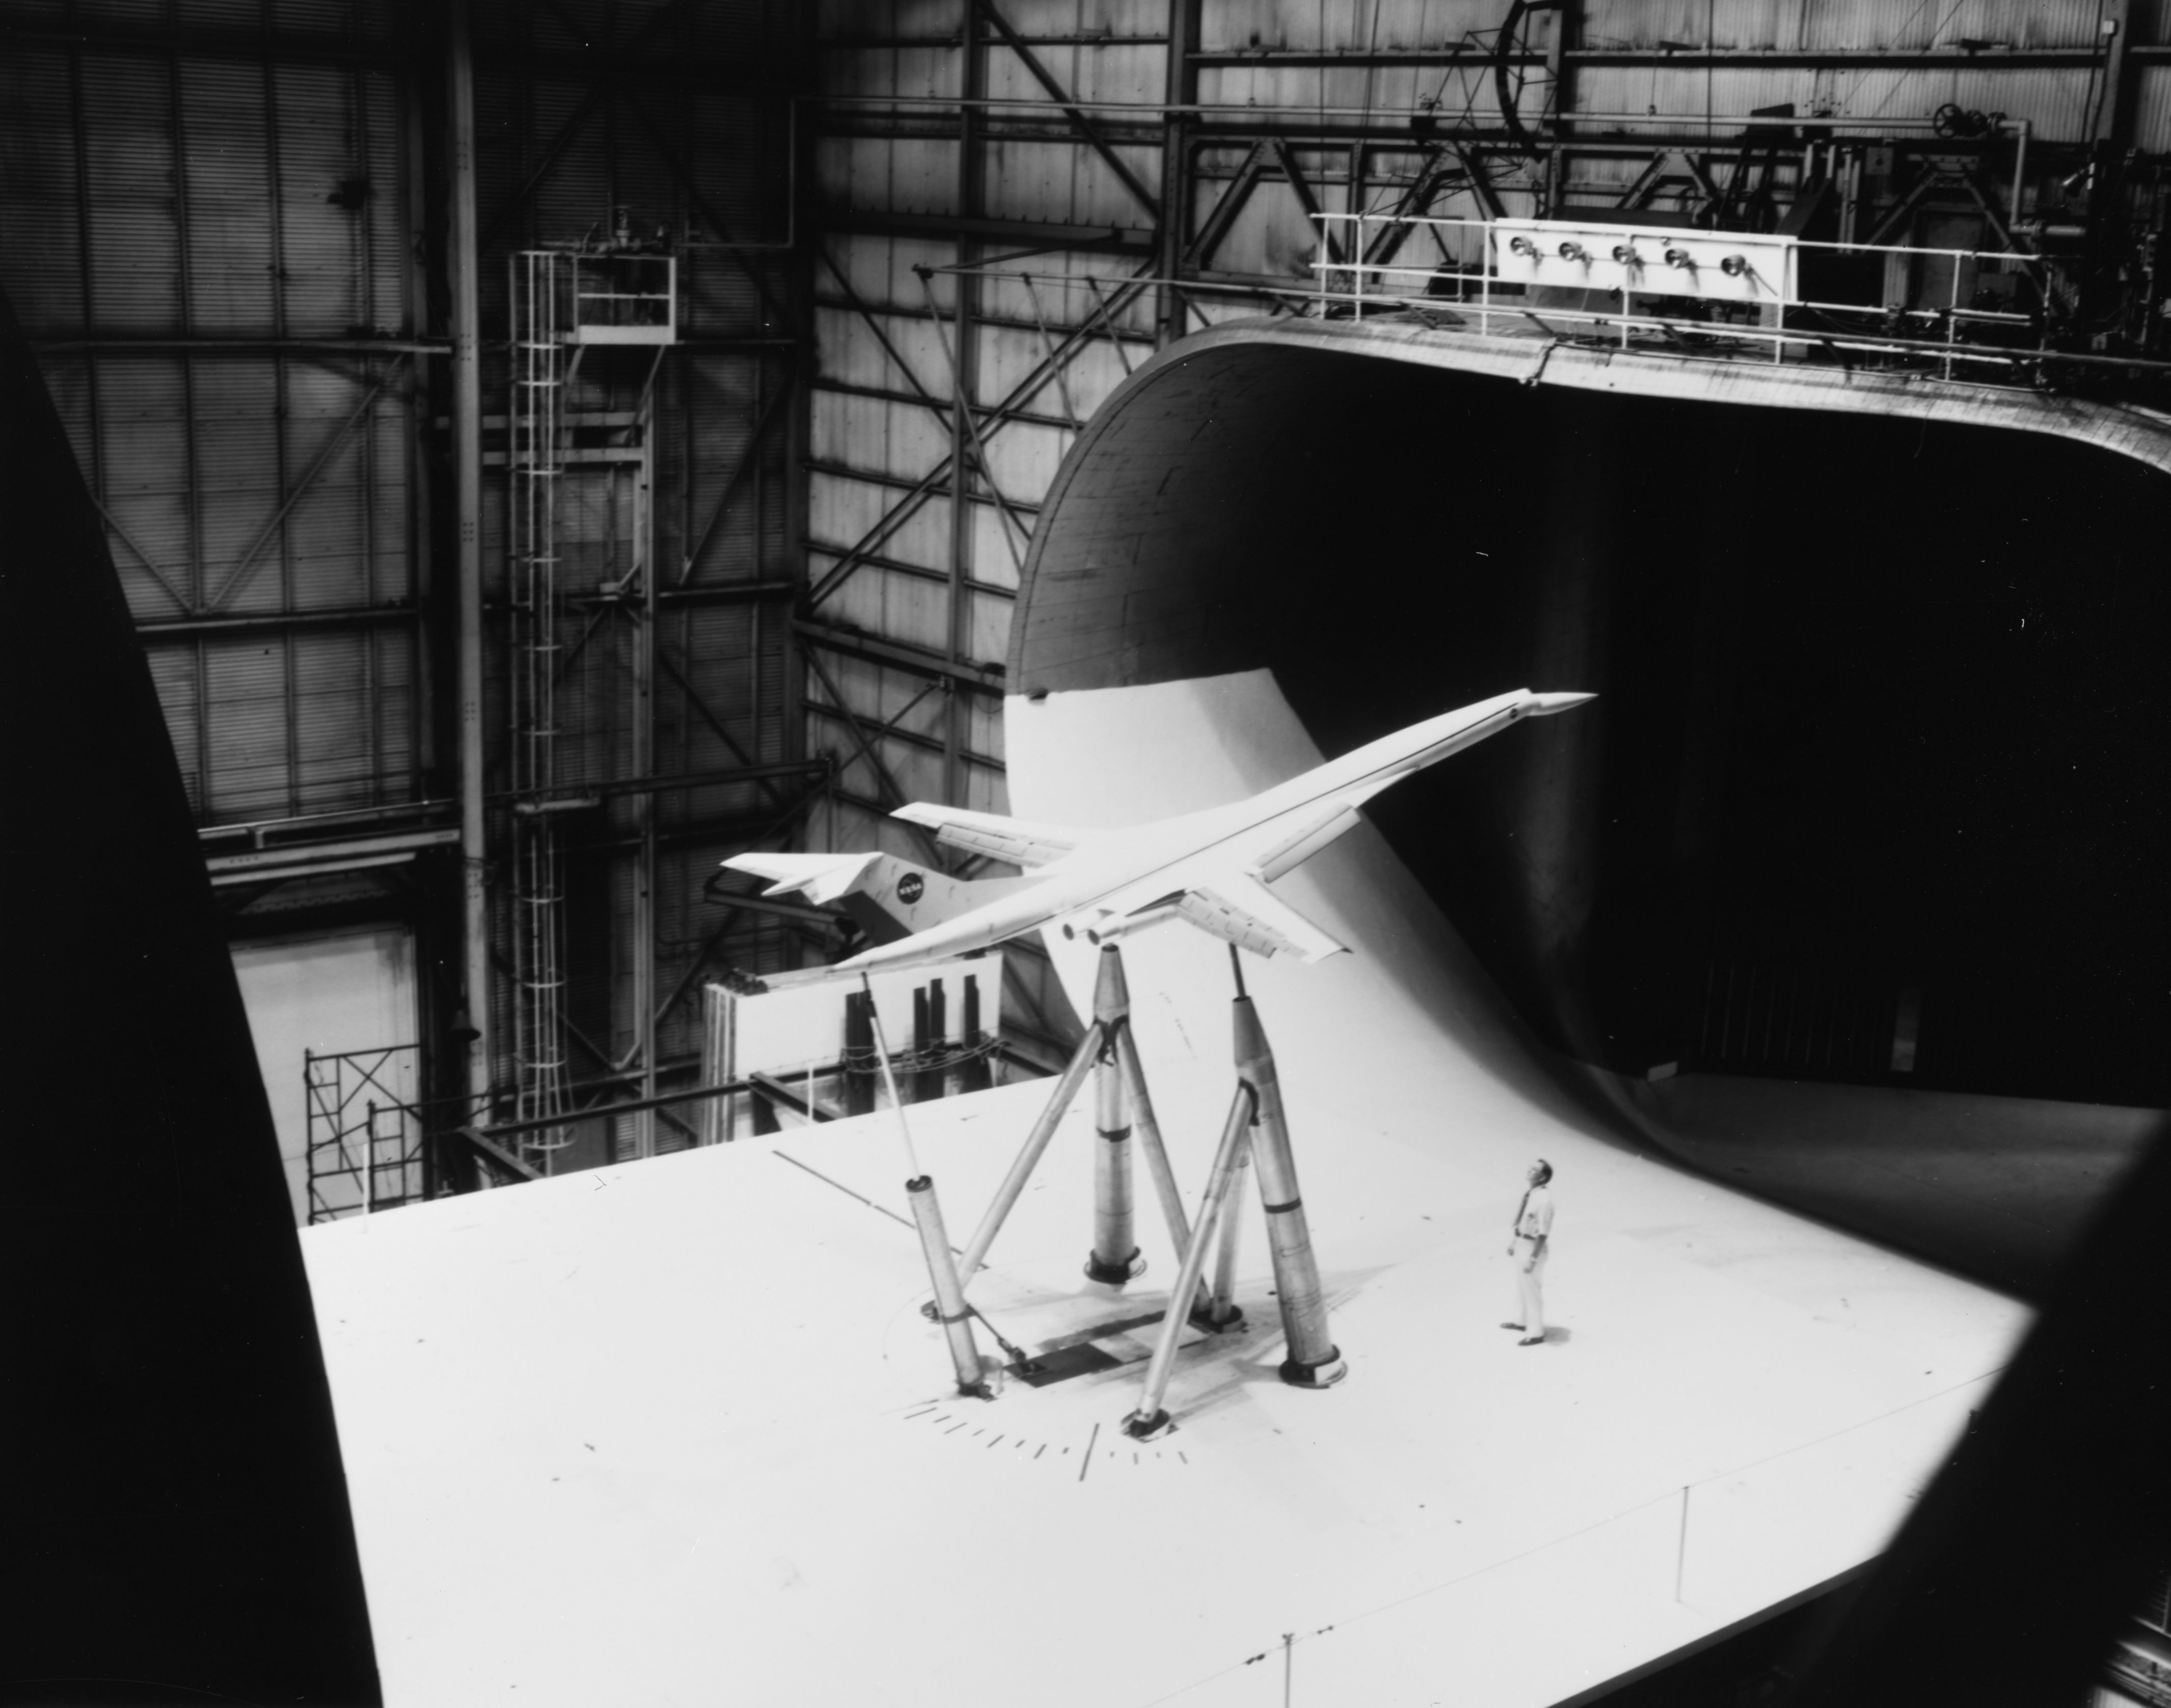
![NASA Langley subsonic wind tunnel [2]](https://rgroh.com/wp-content/uploads/2015/05/14x22_Subsonic_Tunnel_NASA_Langley.jpg)
![Transonic shock wave [4]](https://rgroh.com/wp-content/uploads/2015/05/Transonic_flow_patterns.svg_.png)
![Grooved airport runway [3]](https://rgroh.com/wp-content/uploads/2015/05/Pista_Congonhas03.jpg)